


How Do Different Generations Renovate Their Homes?
New research shows how age affects where people live and their renovation choices

Which generation spends the most on renovations? What motivates each age group to carry out a project and how do they fund it?
The answers to these questions and more were revealed in the 2023 UK Houzz & Home Study*, in which more than 2,500 respondents were asked about their renovating activities during 2022 and their plans for the year ahead.
The respondents were divided into three age groups: Gen Y (25-39), Gen X (40-54) and Gen B (55-74). Read on to discover what each generation was up to last year.
* The 2023 UK Houzz & Home Study was sent to registered users of Houzz and fielded from December 2022 to March 2023.
How much does each generation spend on renovations?
According to the report, Gen X spent the most on their renovations last year, with a median spend of £17,500, as opposed to £16,800 for Gen B and £16,750 for Gen Y.
In fact, the main reason for Gen X to renovate in 2022 was that they finally had the financial means to do so, with nearly half of respondents (47%) saying this was their motivation.
Meanwhile, Gen Y respondents were the most likely to cite funding as one of their top three renovation challenges, with 20% saying this was an issue versus 14% of Gen X and 8% of Gen B.
Which professionals are they hiring?
The most frequently hired professionals last year were electricians, with more than half of all age groups saying they used specialists from this category.
The most likely age group to hire a window or door specialist was Gen Y, while Gen B were inclined more than the other age groups to hire a landscape contractor.
It seems as if those in Gen X were taking on larger projects, with 38% hiring a builder versus 25% of Gen Y and 27% of Gen B.
Which rooms are homeowners renovating?
The favourite room for Gen Y to renovate was the bedroom, with 45% of this age group saying they’d renovated or added this space in 2022.
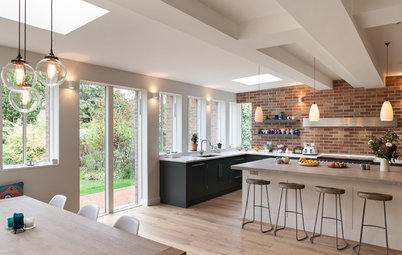
Gen X were focused more on kitchens, as 40% of this group said they’d renovated this room, while the preferred space to upgrade for Gen B was the living room (37%).
Kitchens and bathrooms were popular rooms for all age groups to focus on (37% and 33% respectively), while of all the rooms inside the house, lofts were the least preferred space to renovate (10%).
The favourite room for Gen Y to renovate was the bedroom, with 45% of this age group saying they’d renovated or added this space in 2022.
Gen X were focused more on kitchens, as 40% of this group said they’d renovated this room, while the preferred space to upgrade for Gen B was the living room (37%).
Kitchens and bathrooms were popular rooms for all age groups to focus on (37% and 33% respectively), while of all the rooms inside the house, lofts were the least preferred space to renovate (10%).
How are different age groups funding their projects?
The majority of homeowners are funding their projects through cash or savings, with an average of 80% saying they’d used this means to pay for their project.
Gen Y were the most likely of all age groups to use a credit card (18% vs 11% of Gen X and 8% of Gen B), while 22% of Gen B respondents paid for their renovation with cash from a home sale (as opposed to 18% of Gen X and 10% of Gen Y).
Why are homeowners renovating?
The majority of our survey respondents were renovating for the long-haul, with more than three-in-five homeowners (62%) planning to stay in their property for 11 years or longer.
While it might be predictable that older generations had found their forever home (46%), a surprising 24% of Gen Y and 36% of Gen X are also hoping to stay put in their current properties.
Only 7% of Gen Y and Gen B chose to renovate in order to increase their home’s resale value, and just 5% of Gen X had the same motivation.
Energy-efficiency was a big motivator for all age groups, with almost half of each generation giving this as an important factor for influencing their decision to renovate.
Tell us…
Do these report findings reflect your experience? Share your thoughts in the Comments.


Sponsored
Reload the page to not see this specific ad anymore
Period homes were the most popular type of property to live in for all age groups in our study, and those in Gen X were most likely to own a home that was built before 1900.
The age group most inclined to live in a midcentury property was Gen Y (14% as opposed to 10% of the other two age groups), while those aged between 55 and 74 (Gen B) were most likely to own a late-20th century home (14% vs 8% of Gen Y and 9% of Gen X).