How to View and Analyse Your Lead Insights
Last updated: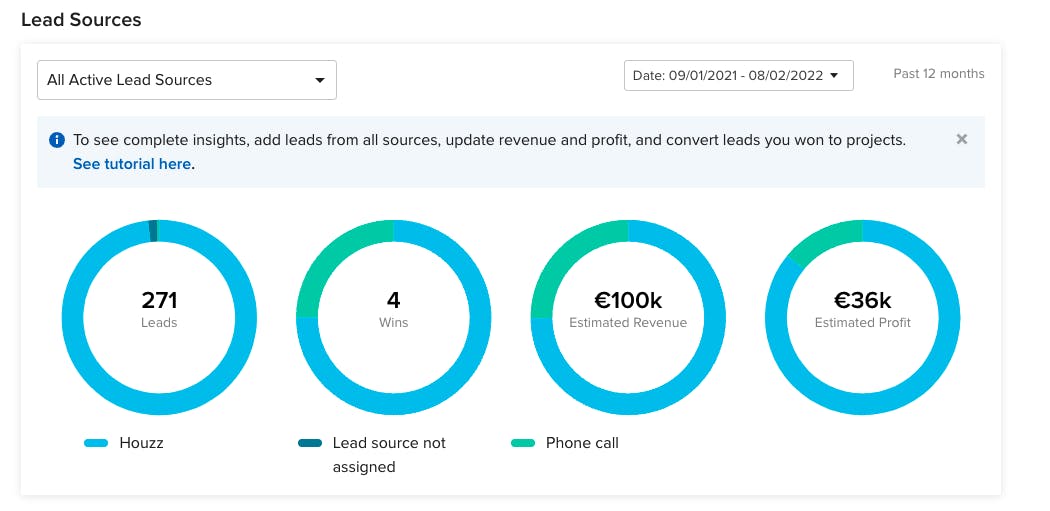
In the Lead Insights section, you can view and analyse the data on how your leads are performing. These metrics will help you know which efforts to continue and where there’s room to improve when it comes to lead generation, so you can more efficiently run your business.
Watch this tutorial to learn more about understanding your Lead Insights:
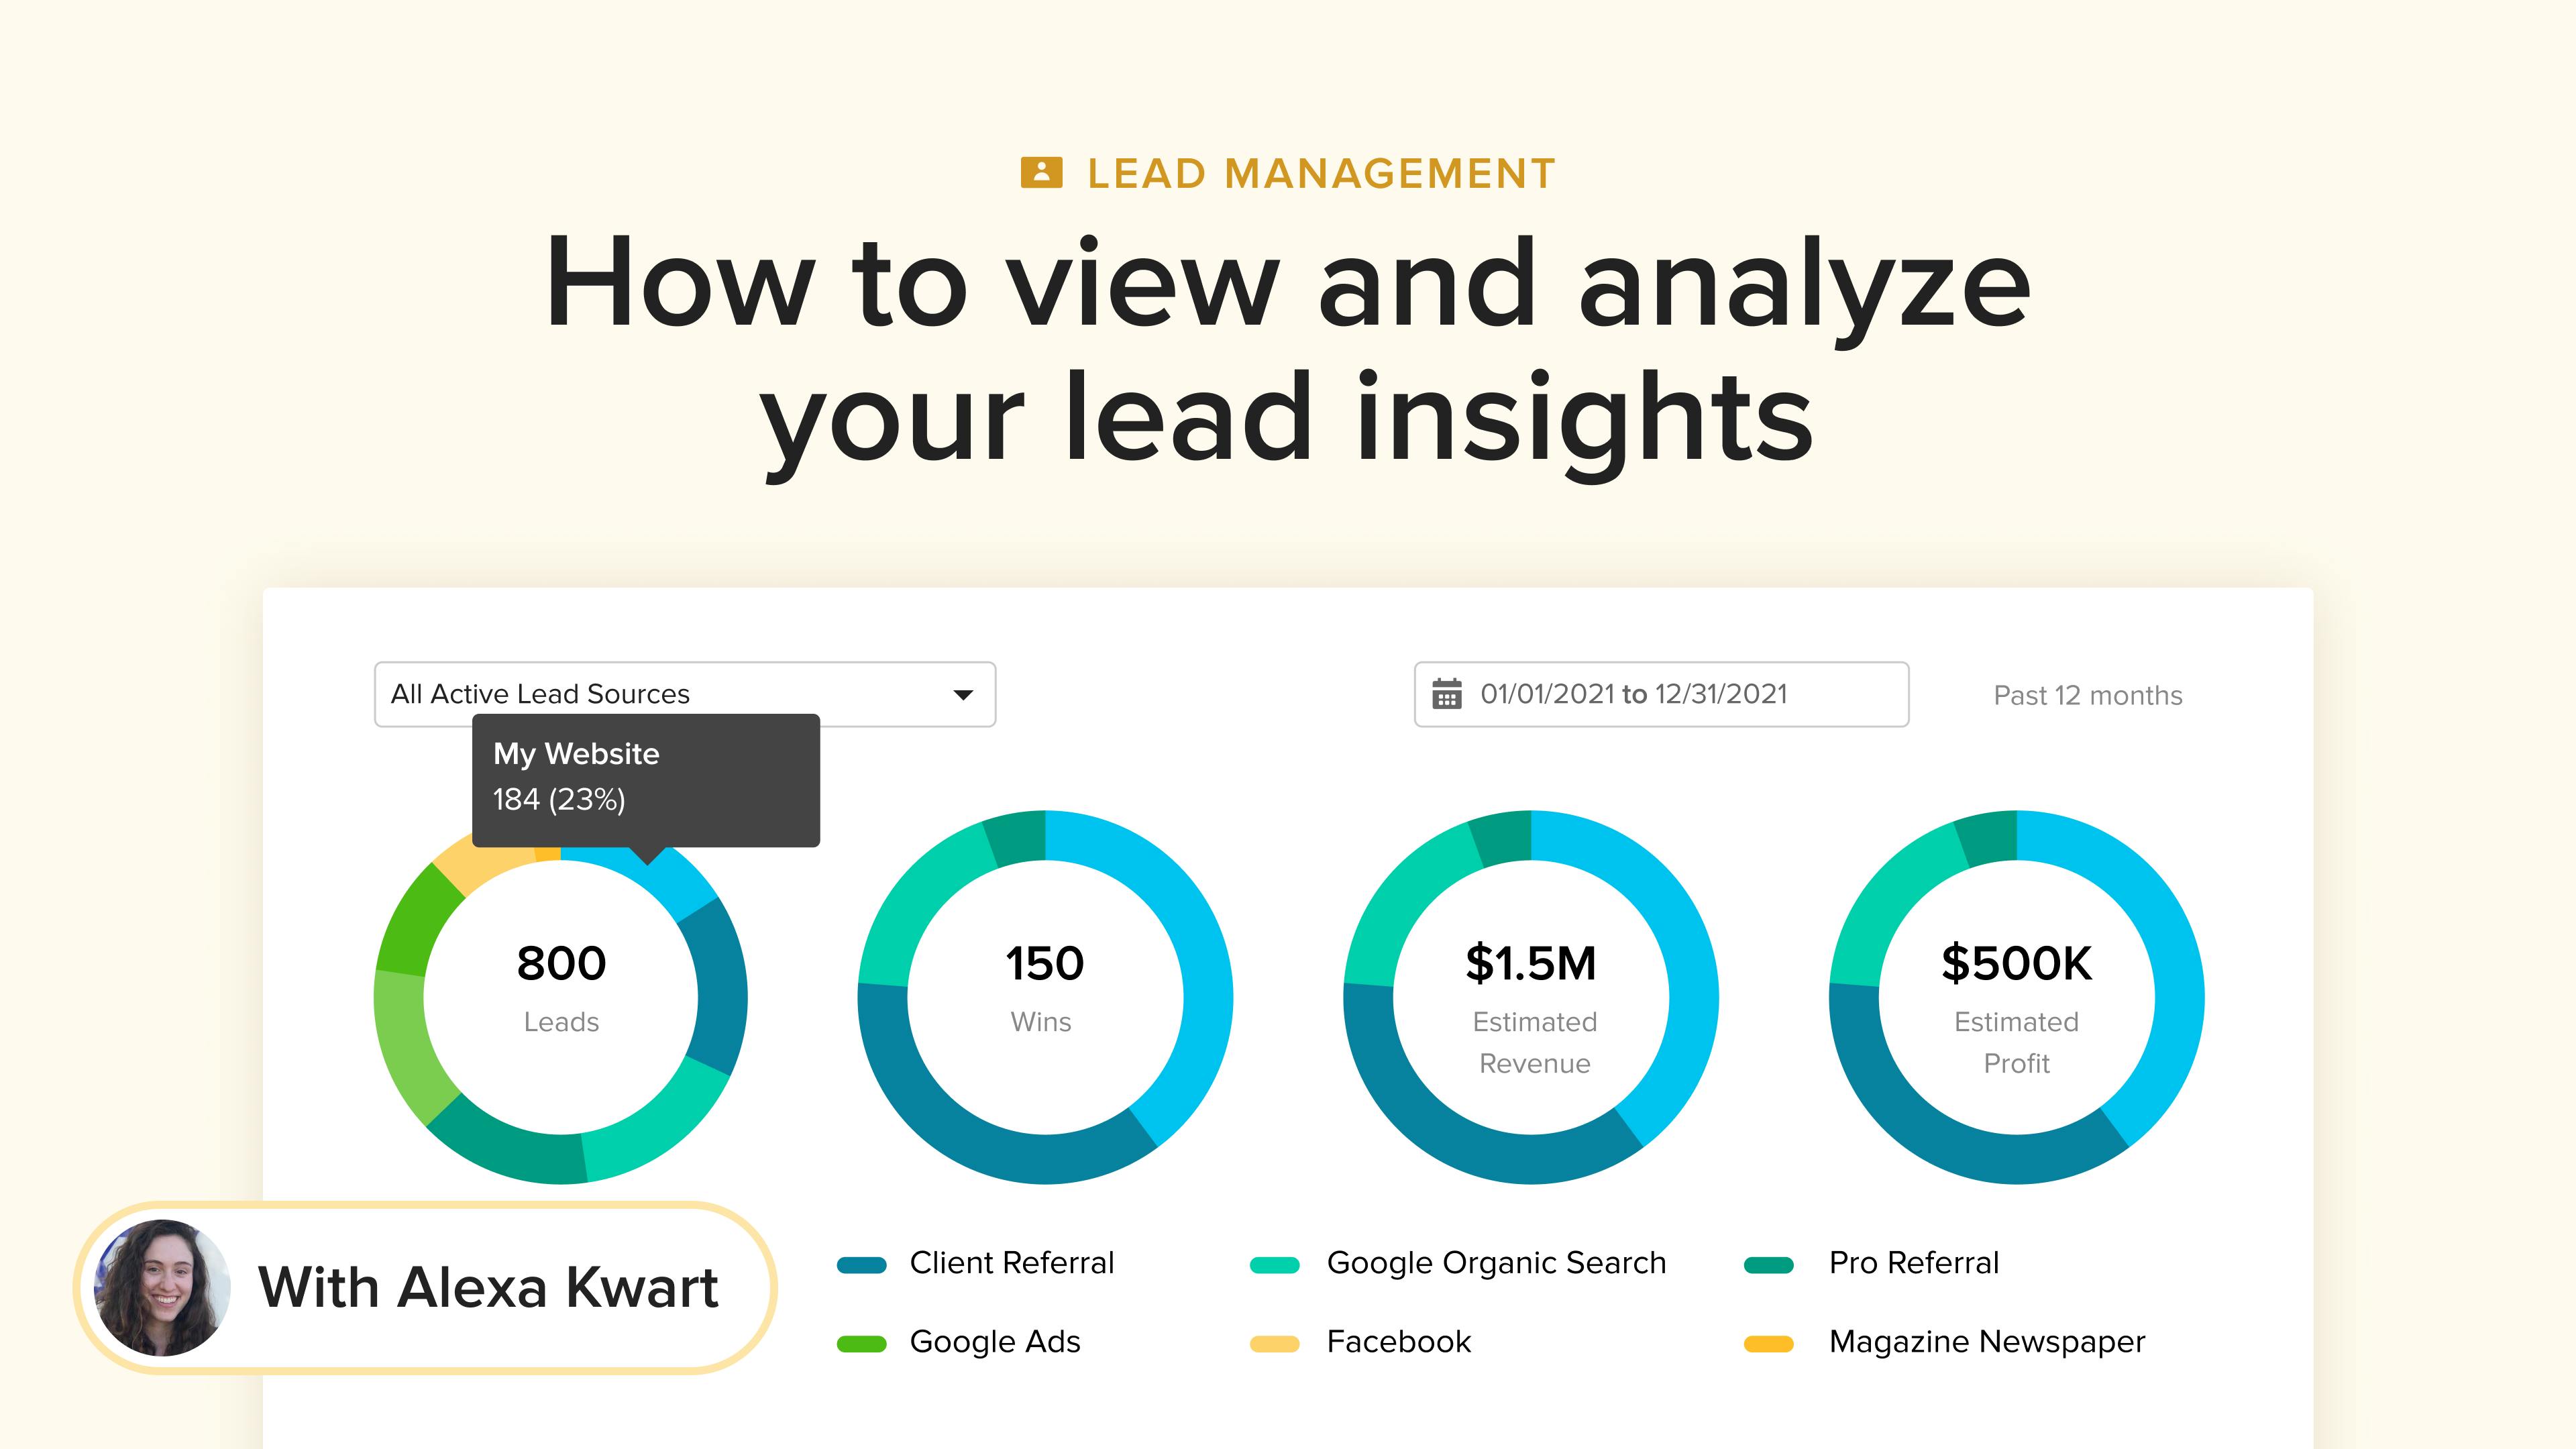
You can filter the data by lead source, such as leads from Houzz, client referrals, etc., and by date. The data is organised into 4 different pie charts:
- Leads - this is where you’ll see a breakdown by lead source of all the leads you’ve received
- Wins - this is where you’ll see a breakdown by lead source of the leads you’ve received that have turned into projects
- Estimated Revenue - this this is where you’ll see a breakdown by lead source of the estimate revenue generated from leads you won
- Estimated Profit - this this is where you’ll see a breakdown by lead source of the estimate profit generated from leads you won
If there’s a Lead Source pie chart that’s blank, simply fill in the lead details for estimated revenue and profit, and convert the leads you won into projects. Then all your charts will show data.
Still need help?